Lazy Monkeys
Left overnight, our monkeys are able to count to 3. It’s not terribly impressive, really, so let’s see what we can do to reduce that time.
Multicore Monkeys
The current system, being completely random, is perfect for parallelization. We have a single unit, comprising of a code generator, virtual machine and evaluator, which churns out program attempts until a target score is reached. We can easily encapsulate this unit and spawn multiple instances of it which will run almost entirely independently of each other. This involves a few tweaks:
- Spawn X units, each on their own thread
- Initialise each unit with a unique random seed and begin execution
- Whenever a unit beats its high score, report it back to the main thread and continue executing
- Have the main thread inform all units of the new high score
- Repeat until the target score is reached
In terms of thread safety, the only thing we’ll need is a simple mutex around the code that checks and reports the high score, otherwise we can have some undesirable behaviour such as a 2nd thread incorrectly reporting a lower scoring program than the previous reporting thread.
We’ll be running on an Intel i7-5930K, an 8 year old processor (yikes!) with 6 hyper-threaded cores (12 ‘logical processors’). Performance will be measured in Monkeys Per Second (MPS), 1 monkey being the creation, execution and evaluation of a single program. Our single threaded starting point is around 1.5 million MPS.
Attempt #1 : Threading.Tasks
The Threading.Tasks system seemed like a handy way to handle our monkey units without having to manage threads manually. I figured we’d try that first since it’s so trivial to set up. Each unit is run as a Task and flagged as LongRunning to let the scheduler know that it’s going to execute for a long time.
I’m going with 10 units/Tasks. I figure that will make use of each of the 6 cores, and in some cases run 2 units per core, and still leave some crumbs for Windows to play with. I’d expect a fairly solid 6x increase for the first 6 units, assuming the scheduler was being kind, but really didn’t know what to expect for the remaining 4.
The result is 10.7 million MPS, around 7 times faster than the single core.
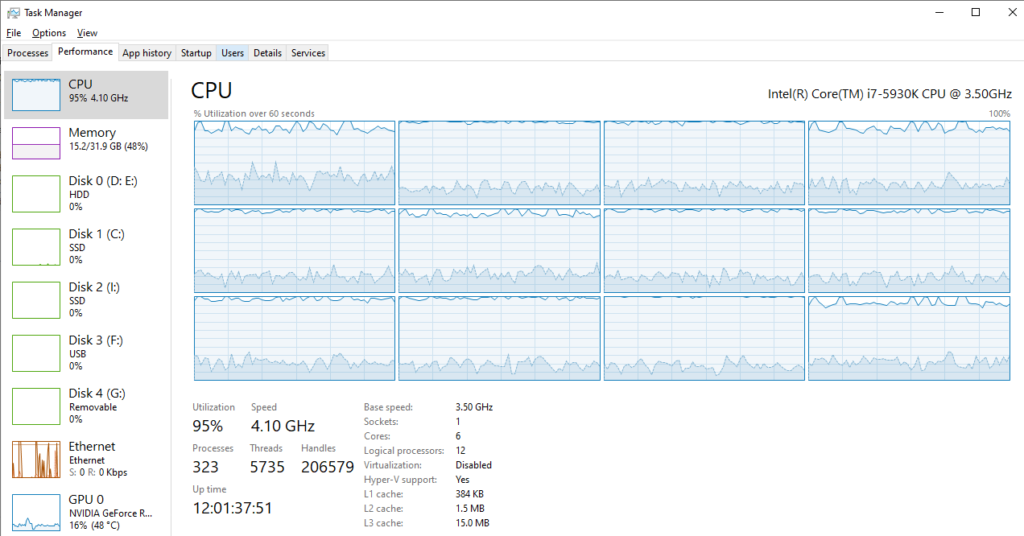
Just looking at the Task Manager, above, there’s a spread across all 12 logical processors which I wasn’t expecting. Is the Task scheduler moving our units around more than we’d like?
Attempt #2 : Manual Thread Management
Another quick test is to create a single Thread per monkey unit.
I tried setting the affinity of the 10 Threads to the first 10 logical processors reported by the environment. This was a mistake, since the affinity mapping sequentially maps every thread of a core before moving to the next core. So our 10 Threads were forced onto 5 cores and the performance was noticeably worse than our Task approach.
So, make sure we prioritize the first thread of each core (affinity 0, 2, 4, 6, 8 + 10) then assign the remaining 4 to whatever is remaining (1, 3, 5 + 7).
This resulted in pretty much the same performance as the Task approach, the only difference being that the Threads were not being moved between cores at all. Whatever the Task scheduler was doing, it doesn’t seem particularly costly.
Attempt #3 : Free Range Threads
The last attempt is to just run 10 threads and let the OS deal with them however it sees fit. The results were also the same as the LongRunning Tasks and Threads with properly assigned affinity.
My takeaway? Don’t fight Windows, it’s not worth the effort, at least for what we’re trying to achieve here.
Visual Studio Performance Profiling
Next, we’ll do some good old-fashioned profiling on a single unit to identify any low-hanging-fruit optimisations. It’s a chance to get to know the Visual Studio performance tools which I’ve never touched before, since most game engines include their own tools.
Our starting point, on a single core, is 1.78m MPS. I have no idea what I did to speed them up since the 1.5m at the start of this post, I think it depends how the OS is feeling on any particular day.
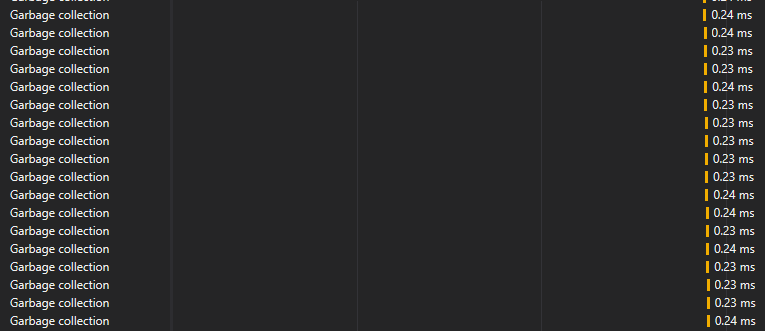
First, a quick look at the application timeline, and it’s not at all surprising that it’s spending a lot of time collecting garbage:
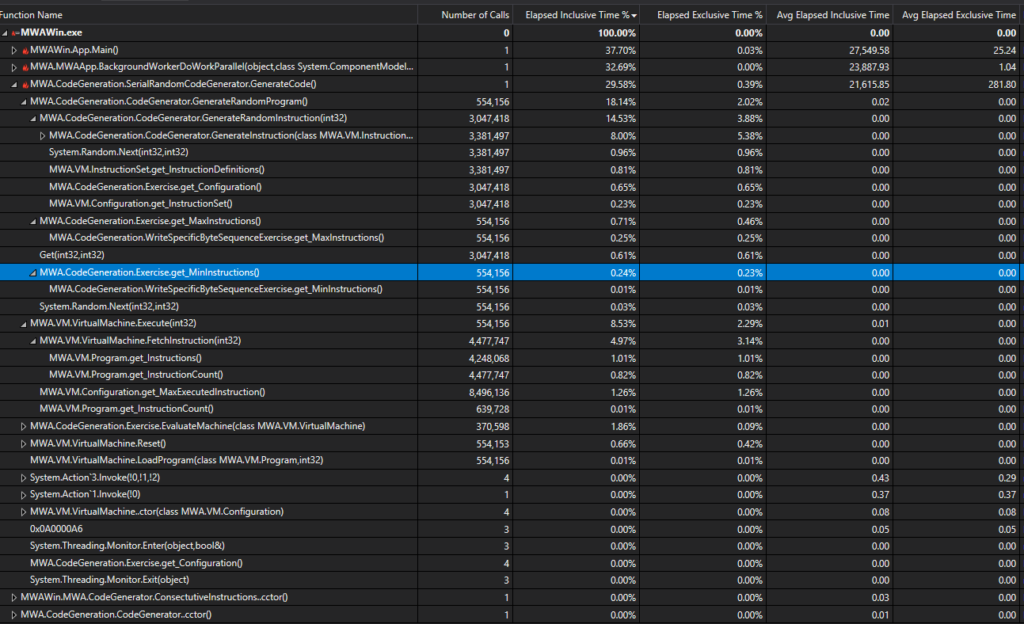
Then a quick look at CPU usage:
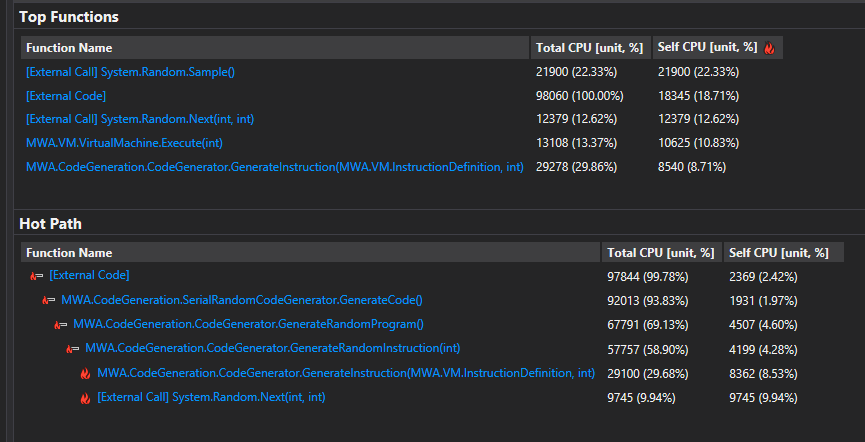
- Only 13% of the CPU is spent actually running our generated code on the virtual machine, the vast majority is spent on code generation.
- Focus should first be on the code generation, particularly memory allocation.
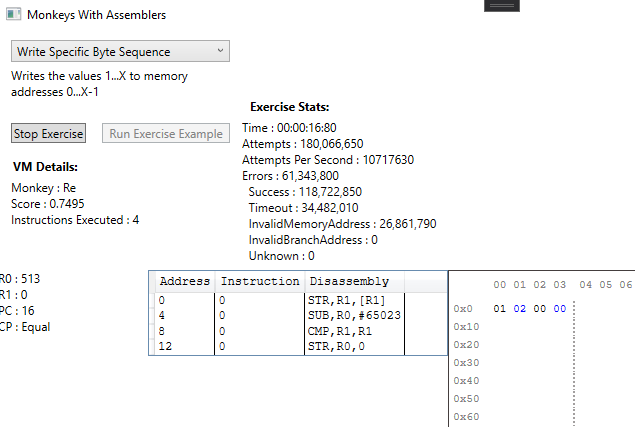
First up, I removed the Instruction class which was a data class that stored the opcode, registers and values for an instruction. It was handy for prototyping and debugging but insanely inefficient. Instead I just encode the operation into an unsigned int. That way it properly represents how the code would be laid out in memory on a real machine, and is much more efficient in terms of memory and cache use. It also allowed me to finally fill in that empty column in the VM program window!

That got us up to 2 million monkeys, from 1.78.
Profiling again highlighted an awful lot of time spent in simple accessors:
I don’t know how much of that is down to code modification caused by instrumentation, but tweaking the code to directly access and/or cache these values gave us another 5% gain:


Looking at the new results, any remaining optimisations seem fiddly and would probably require coding C# in an unsafe way that somewhat defeats the purpose of using C#. We’ve seen a gain of approximately 20% on a single core and 30% across all 10 cores by making a few simple optimisations, hitting 14.1 million monkeys per second. Maybe we could improve it by another 20 or 30% if we keep on drilling down but we’d see increasingly diminishing returns and it would be pretty tedious.
Instead of that, I’m super curious to know what kind of gains we’d see by converting the monkey units to C++. I’ve always been curious about the performance difference between C# and C++ and our codebase is now complex enough to provide us with more interesting numbers than the simple algorithms that are often used to compare the two.
C Monkeys
The first step was to convert the entire codebase to C++, with the exception of the UI. I went with a simple copy/paste/fix approach because I think that will give us a fair performance comparison. The C++ was wrapped up in a static library and I created a C++/CLI wrapper DLL to that library which was certainly a learning process!
It all resulted in this magic button in the UI, allowing us to easily switch between the two languages:

During the conversion I found a couple of major performance problems:
- 2 remaining memory allocations per monkey. Every time we generated a program, we were allocating storage for a Program class and storage for the list of instructions. This was ridiculously slow in C++ and resulting in a lot of GC collections in C#.
- The standard C++ rand() is incredibly slow, and we’re calling it multiple times for each instruction created.
The memory issue is easy to fix, we can just reuse objects, but we need an alternative to rand() and a Google search led me to this incredibly useful post which compares a bunch of different generators:
https://thompsonsed.co.uk/random-number-generators-for-c-performance-tested
I decided to go with xoshiro128+ for now. More info from the creators here: https://prng.di.unimi.it/
I applied the memory fix and PRNG changes to both C# and C++ and it dramatically improved the numbers for both implementations. Here are the profiling results with and without the changes in both languages:
| C# (MPS) | C++ (MPS) | |
| 2 Allocs Per Monkey, System Random | 16,572,300 | 9,990,618 |
| 2 Allocs Per Monkey, Custom Random | 17,421,975 | 13,958,524 |
| No Allocs, Custom Random | 20,601,439 | 28,877,928 |
I’m impressed that the C# version is now at 20 million MPS, 13 times faster than our initial implementation, but look at those C++ numbers! Once you cut out the system calls, it’s 40% faster than its C# cousin. We’re probably also being generous to C# since that version has been optimized more than most programmers would care to consider (see all replies to any C# optimisation question on Stack Overflow if you need proof) and we haven’t yet taken advantage of the tools that C++ now provides us with.
So, let’s go with C++ and see if we can squeeze some more juice out of these monkeys.
vTune
Another profiling tool I’m unfamiliar with is Intel’s vTune, so I thought I’d give it a try. It’s a very impressive tool that really delves into low level performance analysis and I could happily spend weeks getting to know it intimately, but for now I just want a high level overview.
First, a Performance Snapshot, capturing 5 seconds of data shortly after the app has warmed up (the first couple of seconds are a mess while all 10 monkeys try to report their pretty terrible first attempts):
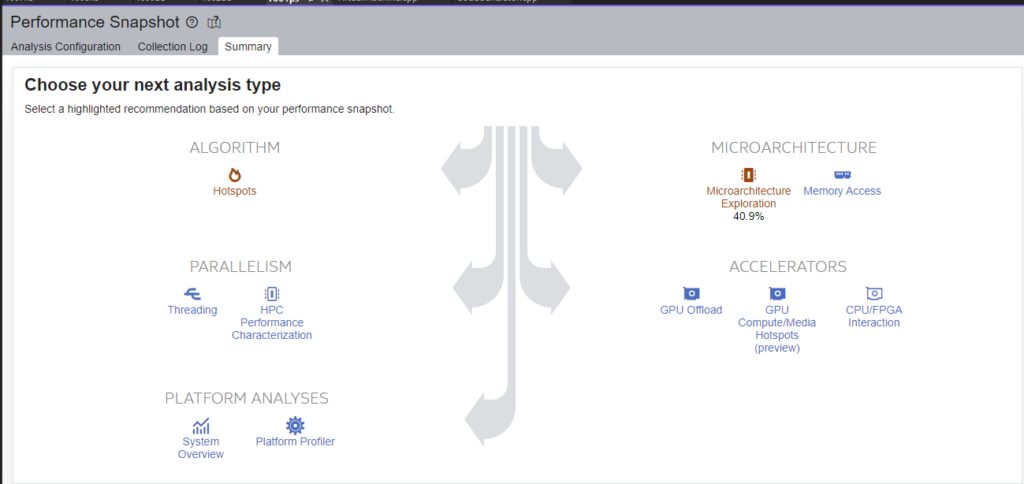
This recommended a Microarchitecture Exploration:
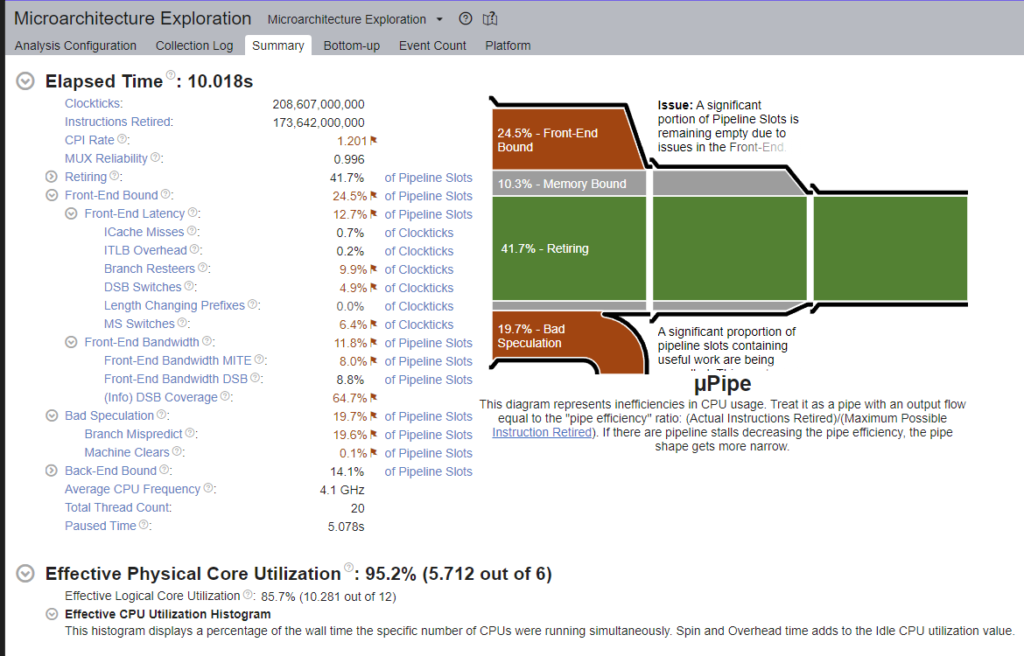
That’s a lot of data to absorb. The interface has tooltips for pretty much every single piece of information on that screen and seems to offer pretty useful advice on how to begin addressing the highlighted issues.
I’m not entirely certain of what I’m looking at, but what I’m taking from this is that we have a bunch of branch mispredictions which are probably down to the commonly executed switch statements and conditions in both the VM and the CodeGenerator.
A Memory Access analysis gave us this:
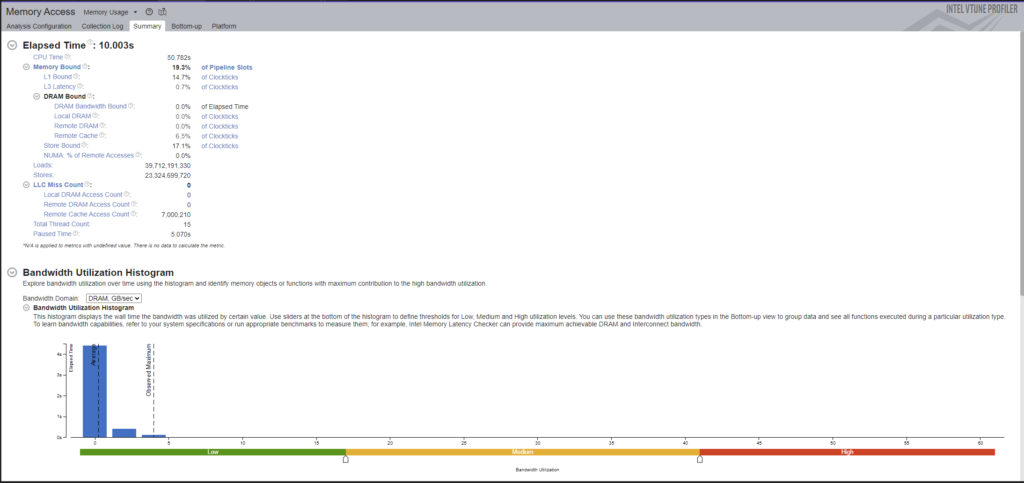
From what I can tell we’re not missing the L1 cache *too* much, but I’m not certain I’ve measured this correctly.
However, I wouldn’t expect memory to be our biggest issue. We’re only using a very small set of objects which each manage a small set of data, we create the data that we consume ourselves (the programs) and we don’t rely much on external data to drive the system, only some instruction definitions and instruction order hints.
That said, there were a few obvious improvements I wanted to make anyway:
- The VM’s registers, program and data memory were all allocated separately. I turned this into a single memory allocation so that the data is stored right after the class in memory, making it very cache friendly.
- This new VM was taking 80 bytes, I squished it down so that it fits into a 64 byte cache line.
- Exposed the program storage address from VM and let code generator populate it directly, instead of passing around separate program memory.
- Found a dumb error where I was assigning a class by value in a core loop because of a C#->C++ copy/paste mistake. Fixing that gave us an extra 1 million MPS!
- Compacted and moved all of the static, readonly data, used in the generation of programs, to a single area of memory so that it’s more likely to be available in the cache when required.
I didn’t try to reduce the effect of branch mispredictions for now. I need to read up on the topic first, but I’m also expecting to change a lot of the logic in the near future and it would just make the code harder to maintain.
Results
Finally, we’re able to run at 31 million MPS. That’s over 20x faster than our initial, single core implementation. That’s an awful lot of monkeys!
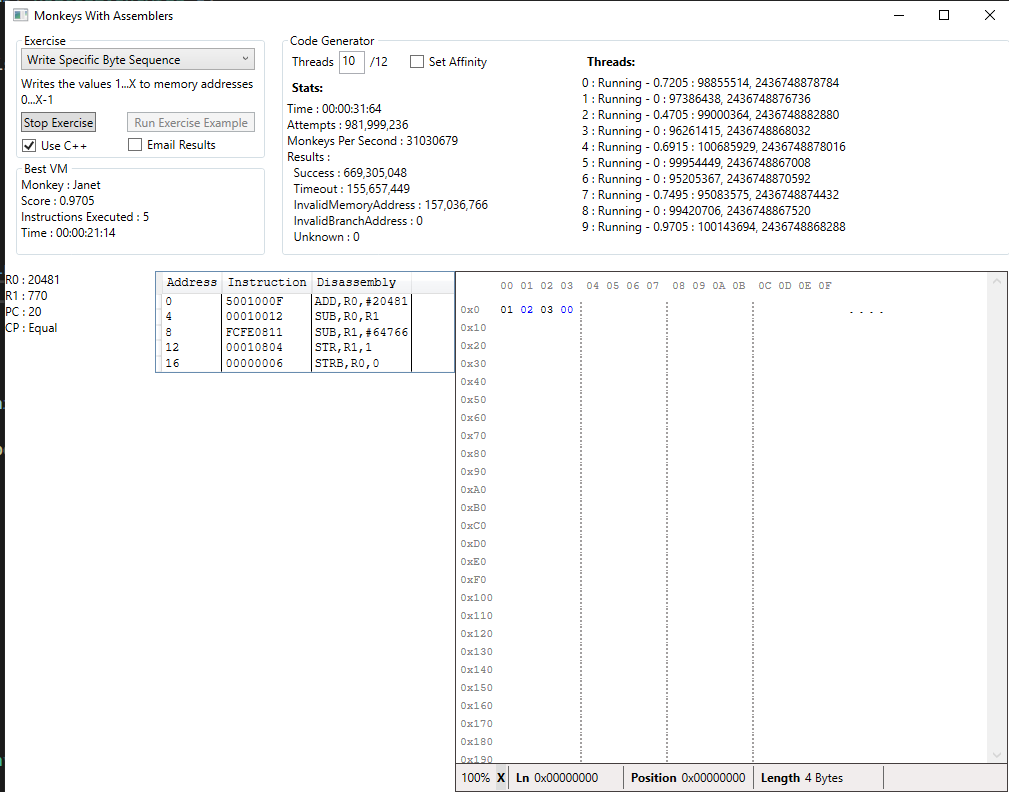
Finally, as you can see, I made some interface improvements too:
- Added an option to email the results, making it easier to leave this running while I do other things
- Options to tweak the number of threads and whether we set their affinity or let Windows manage it
- Some debugging info on the threads themselves (best score reported, number of attempts, random seed)
- Layout improvements
What Next?
We can now find an optimal solution to the sequence exercise in around 20 minutes, on average, when it previously took around 8 hours. That’s great, but it would be nice if the monkeys could do something more interesting. I guess that’s the next, ever-so-slightly terrifying challenge!